React Performance: From Audit to Optimization
January 3, 2026
Imagine a bookshelf. If you want to read a specific book, you simply take it off the shelf. The other books stay put. But in a poorly optimized React application, taking one book off the shelf causes every other book to fall off and be put back one by one.
This phenomenon is known as a Wasted Render. It's the most common cause of performance issues in React apps. This guide will teach you a systematic approach to finding and fixing these issues—moving beyond random optimizations to establish a repeatable, data-driven process.
Golden Rule:"Measure, don't guess." Premature optimization is the root of all evil. Only optimize when the Profiler proves you have a problem!
Part 1: The Audit Strategy
Before opening DevTools, you need a plan. Without a strategy, you risk optimizing things that don't impact the business. Many developers treat performance as a bug fix: see something slow, hack at it until it feels faster. But in professional development, performance is a system, not a task.
Understanding Web Vitals
Google's Web Vitals are the industry standard for measuring user experience. You must track these metrics in your React app:
- LCP (Largest Contentful Paint) — How fast does the main content load? This measures perceived speed.
- CLS (Cumulative Layout Shift) — Does the page jump around? A common React issue is lazy-loaded components popping in unexpectedly.
- INP (Interaction to Next Paint) — How fast does the browser respond when I click? React hydration can block the main thread and hurt this metric.
RUM vs Synthetic Monitoring
You need two types of eyes on your application. RUM and Synthetic monitoring serve different purposes:
- Real User Monitoring (RUM) — Data from actual users. High variability because of different phones, networks, locations. Shows real pain points.
- Synthetic Monitoring — Automated tests in controlled environments. Low variability. Catches regressions before deployment.
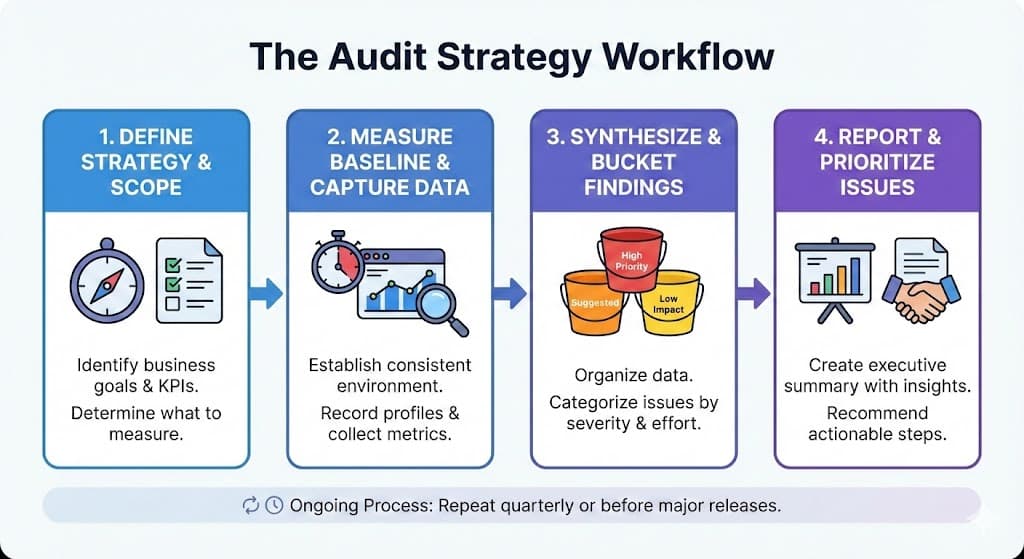
The Audit Workflow
Don't wing it. Follow this repeatable cycle:
- Strategy:Define scope (e.g., "Holiday Landing Page") and KPIs (e.g., "Add-to-cart conversion rate").
- Measure: Establish a baseline using a clean environment (Guest Mode, specific browser profile).
- Synthesize: Organize findings into three buckets: Highly Recommended (quick wins), Suggested (needs analysis), and Maybe Later (low priority).
Part 2: Understanding React's Rendering Cycle
To fix performance issues, you must understand how React works under the hood. The rendering process happens in three phases:
- Trigger: State or Props change.
- Render Phase (The "Diff"): React calls your component functions to determine what the UI should look like. It compares the new tree with the old tree.
- Commit Phase (The "Paint"): React applies the changes to the real DOM.
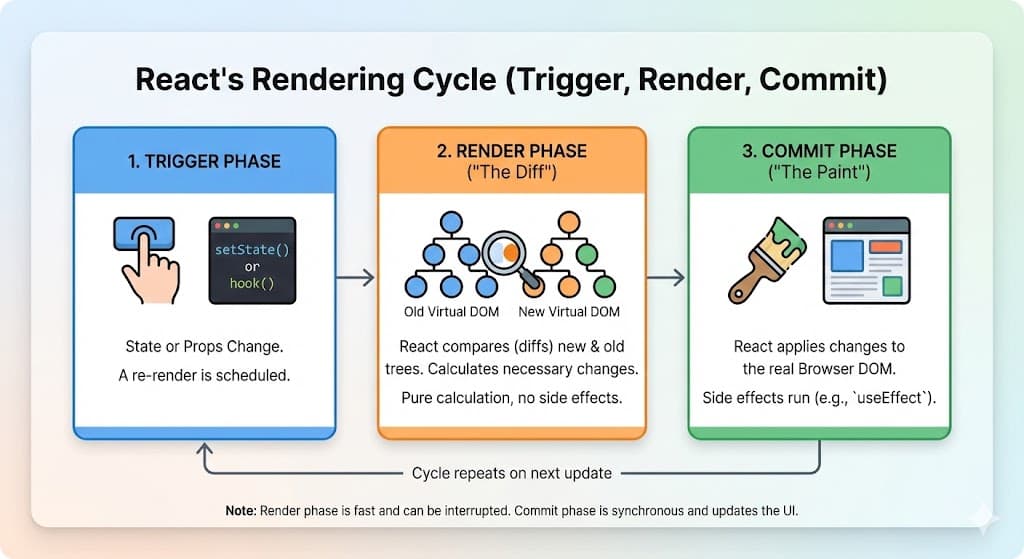
The Trap:Developers often confuse the Render Phase with the Commit Phase. React runs your component's JavaScript logic every time a parent renders—but it only touches the DOM if the output is different. The performance cost comes from running that JavaScript logic unnecessarily!
The Root Cause: Shallow Equality
Why do components render when they don't need to? Usually it's due to Shallow Equality. React compares props using the strict equality operator (===). This works fine for primitives like numbers and strings, but Objects, Arrays, and Functions are reference types. Creating a new one during a render cycle makes React think the data is "new", forcing a re-render.
Part 3: Your Performance Toolkit
The audit relies on three specific tools to diagnose different layers of the application.
Tool 1: React DevTools Profiler
This tells you which components are rendering and why. Open React DevTools, go to the Profiler tab, and record a session.
- The Flamegraph: Each bar is a component. Gray = did not render (good). Yellow/Red = took time to render (investigate).
- Exclusive vs Inclusive Time: Exclusive is time spent in just this component. Inclusive includes all children too.
- Pro Tip:Look for the "Commit" timeline. Many rapid commits often means state thrashing.
Enable "Record why each component rendered while profiling" in DevTools settings to see exactly why each component re-rendered!
Tool 2: Chrome Performance Tab
When React DevTools says a component took 200ms, the Chrome Performance tab tells youwhat specific JavaScript function caused it.
- Self Time: How long a specific function took (excluding functions it called).
- The Call Stack:Look for "Deep V" shapes which indicate massive recursion or heavy computation.
Tool 3: Memory Profiler
React apps are long-lived Single Page Applications. If you don't manage memory, the browser tab will crash.
- Heap Snapshot: Take a photo of memory before and after an action. Compare to find leaks.
- Detached DOM Nodes:A common SPA leak. If you navigate away but keep references to old DOM nodes, garbage collection can't clear them.
Programmatic Profiling
Sometimes you need to measure performance in production. React provides a native Profiler API for this.
View Profiler API Example — See how to wrap components with the Profiler and send metrics to analytics.
Part 4: Fixing Wasted Renders
Now that you can identify problems, let's fix them. Follow this order of operations:
Strategy 1: Fix Your Architecture First
Before reaching for memoization hooks, fix the underlying architecture issues.
Split Your Contexts
A common mistake is putting high-frequency data (like scroll position) in the same Context as low-frequency data (like user profile). Every time the user scrolls, everything re-renders!
View Context Splitting Pattern — See how to split contexts by update frequency.
Use the Slot Pattern
There's a difference between a component's Parent (contains it in DOM) and its Owner(created the element). You can "lift ownership" using the slot pattern to prevent re-renders.
View Slot Pattern Example — Learn how passing components as children prevents wasted renders.
Strategy 2: Stabilize Your References
If you're passing functions or objects to children, you need to keep their "identity" stable across renders.
useCallback for Functions
When you define a function inside a component and pass it to a child, that child sees a "new" function every single time. useCallback fixes this.
View useCallback Example — See how to stabilize function references.
useMemo for Objects and Arrays
Use useMemowhen you're calculating expensive data OR passing a complex object as a prop.
View useMemo Example — See how to stabilize object references.
Strategy 3: The Shield (React.memo)
Sometimes a parent component mustupdate often, but the child is expensive and shouldn't move. React.memo acts as a shield—it tells React to only render the component if its props have actually changed.
View React.memo Example — See how to protect expensive components from unnecessary re-renders.
Warning:Don't add React.memo everywhere! It adds memory overhead and code complexity. Only use it when the Profiler proves you have a problem.
Strategy 4: Normalize Your State
How you structure state determines how fast your selectors run. Storing data as an array requires iterating to find items—that's O(n) complexity. As your data grows, your app slows down.
View Normalized State Pattern — Learn how to get O(1) instant lookups.
Strategy 5: Choose Your Styling Wisely
How you style your app affects performance more than you might think. Styling strategies have different impacts on the Reconciliation process.
- CSS-in-JS (Styled Components): Creates deep component trees. Every style rule adds a wrapper component, increasing reconciliation cost significantly.
- Atomic CSS (Tailwind): High initial learning curve, but extremely lean. Zero runtime cost and tiny footprint.
- CSS Modules: Solid middle ground. Scoped styles without the runtime cost of CSS-in-JS.
Recommendation: If performance is paramount, move away from runtime CSS-in-JS toward Atomic CSS or CSS Modules.
Strategy 6: Render Props for Fine-Grained Control
While Hooks are great, they have a downside: they tightly couple state to the component that calls them. If a hook updates, the entire component re-renders.
The Render Props Pattern allows you to isolate rendering to a specific sub-section of your JSX. This is especially useful for high-performance forms—typing one letter only re-renders that specific field, not the whole form.
View Render Props Example — See how to isolate field updates in forms.
Part 5: Advanced Escape Hatches
Sometimes React is just too slow for extreme scenarios. Here are some escape hatches.
useDeferredValue for Responsive Inputs
If you have a heavy list that filters as the user types, the typing might feel laggy.useDeferredValue tells React: "Prioritize the user's keystrokes. Update the heavy list when you have CPU time."
View useDeferredValue Example — Keep inputs snappy while rendering heavy lists.
Suspense & Transitions for Priority Updates
React 18 introduced Suspense & Transitions, which let you mark state updates as "urgent" or "non-urgent." This is more powerful than useDeferredValue because you control which updates get deferred, not just values.
- startTransition: Wrap non-urgent state updates to tell React they can be interrupted. Perfect for tab switches, route navigation, or search results.
- Suspense: Shows a fallback UI while async data loads. Combine with transitions to keep the old UI interactive while the new one prepares in the background.
- isPending flag: Shows loading state without blocking user interactions.
View Suspense & Transitions Example — See how to keep tabs responsive while loading heavy data.
The Difference: useDeferredValue defers a value (like search input), while startTransition defers an entire state update (like switching tabs). Use Transitions when you need fine-grained control over which updates are urgent vs non-urgent.
Uncontrolled Components with useRef
For extremely high-frequency updates (like rich text editors or canvas games), letting React manage state is too expensive. Use useRefto hold the DOM node and manipulate it directly. You lose React's safety features, but you gain raw speed.
View Uncontrolled Component Example — See how to achieve 60 FPS canvas drawing without re-renders.
Trade-off:Uncontrolled components bypass React's declarative model. Use them only when performance profiling proves React's rendering is the bottleneck. They're perfect for canvas drawing, real-time audio visualizers, or contentEditable rich text editors.
Part 6: Optimizing Delivery
Optimizing React isn't just about preventing re-renders—it's about how fast you can get your application from the server to the user's device.
The Real User Mindset
Developers often work on high-end MacBooks with fiber internet. Real users browse on mid-range Android phones over spotty 4G. Always test with throttling enabled!
- Developer Mode: 60ms load time (unrealistic)
- Real User Mode:Enable "Slow 3G" in DevTools. That 60ms might become 2.5 seconds!
Tree Shaking Dead Code
Tree Shaking removes unused code during the build. But bundlers are conservative—if they think code might have a side effect, they keep it.
Use Chrome DevTools Coverage tool to see exactly which bytes of code were actually executed vs wasted.
Build Configuration: Browserslist & Source Maps
Your build configuration has a massive impact on bundle size and parsing speed. Two often-overlooked settings can reduce your bundle by 40-60%:
Browserslist
Browserslist tells your bundler which browsers to support. The default configuration includes Internet Explorer 11, which means you're shipping massive polyfills and transpiled code that 99% of your users don't need.
- Check your analytics: If 95%+ of your users are on modern browsers, why support IE 11?
- Update your config: Use
>0.2%, not dead, not op_mini allto target modern browsers only. - The win: Smaller bundles (no polyfills), faster parsing (native syntax), better performance.
Source Maps
Source Mapsare essential for debugging, but they're often larger than your actual code. Shipping them to production users wastes bandwidth and increases load times.
- Development: Use full source maps for debugging.
- Production: Use
hidden-source-mapor disable entirely. Upload maps to error tracking services (Sentry, Datadog) separately. - The win:Users don't download massive .map files, but you can still debug production issues.
View Build Configuration Example — See how to configure browserslist and source maps properly.
Real Impact:Updating browserslist alone can reduce your bundle from 450KB to 180KB. That's a 60% reduction with a 5-line config change!
Code Splitting with React.lazy
Instead of shipping one massive JavaScript file, Code Splitting breaks your app into chunks that load on-demand.
View Code Splitting Example — Learn how to lazy-load heavy components.
Speculative Loading: Predicting User Navigation
Code splitting improves initial page load by shipping only what's needed. But here's the problem: when a user clicks a link to navigate to a new route, the browser has to fetch, parse, and execute that route's JavaScript before it can render the page. That creates lag.
Speculative loading solves this by loading resources beforethe user needs them. When the user hovers over a link or the browser predicts they'll navigate somewhere, we tell the browser to preload that route's code.
The Resource Hint API: prefetch vs preload
Browsers provide <link rel> tags to hint at future resource needs:
- prefetch:"I'm not sure the user will need this, but load it when idle." (Low priority)
- preload:"I'm 90% sure this is needed soon, load it now!" (High priority)
- dns-prefetch:"We'll connect to this domain, so resolve the DNS now."
View Resource Hints Example — See how to implement prefetch and preload.
Framework vs Build Tool: Who Handles This?
React frameworkslike Next.js and Remix understand your app's routing structure at the code level. They automatically inject resource hints when you use their <Link> components. Hover over a Next.js link? The route's JavaScript is prefetched instantly.
Build toolslike Vite, Webpack, or Create React App don't have this insight. They bundle your code but don't know about your routes. Solutions:
- Manual route splitting: Configure entry points and inject hints yourself (tedious).
- Use TanStack Router: Provides route-based code splitting for Vite/Webpack apps.
- Prefetch all chunks:Vite's default—inject module preload hints for all imports (can over-fetch).
The Fetch Priority API
Beyond hints, you can explicitly tell the browser which resources are most critical using the Fetch Priority API. This is especially powerful for images.
For example, setting fetchpriority="high" on your hero image tells the browser to prioritize it over other images. This directly improves your LCP (Largest Contentful Paint) Web Vital.
In Next.js: Use <Image priority /> for above-fold images and <Script strategy="lazyOnload" /> for non-critical third-party scripts.
The Trade-offs
Speculative loading isn't free. Here's what you're trading:
- More server load: The browser makes prefetch requests even if the user never clicks. Solution: Use CDN caching and HTTP headers to serve from edge without hitting your origin.
- More device work:The user's device downloads and parses JavaScript they might not need. Fortunately, browsers are smart—they won't prefetch if the device is busy or on a slow connection.
- Cognitive overhead: You need to track which routes are prefetched, monitor extra network requests, and understand caching behavior.
Best Practice: Start with framework defaults (Next.js auto-prefetches). If using Vite/Webpack, implement route-based splitting with TanStack Router. Only manually optimize if profiling shows slow navigations.
Summary Checklist
When you see performance issues, follow this order of operations:
- Measure: Use the Profiler. Are you seeing yellow bars?
- Simplify: Are you spreading props? Creating inline objects?
- Split: Are high-frequency and low-frequency data in the same Context?
- Stabilize: Use useCallback for handlers and useMemo for objects passed as props.
- Shield: Use React.memo to protect expensive children from noisy parents.
- Defer: Use useDeferredValue for heavy computations tied to user input.
- Split Bundles: Apply React.lazy to heavy routes and modals.
The Lean React Scorecard
When evaluating a new library or pattern, score it against the Lean React Scorecard:
- Rendering: Does it cause unnecessary renders?
- Reconciliation: Does it deepen the component tree (like CSS-in-JS)?
- Footprint: Does it bloat the bundle size?
- Memory: Does it create excessive closures or objects?
- Cognitive Load: Is it hard to reason about (like deep prop drilling)?
If a library scores poorly on 3+ metrics, look for alternatives or isolate its usage to non-critical paths.
Final Thought:"Building the right thing wrong is better than building the wrong thing right... but you can always make the right thing righter."